Modeling Chladni Patterns with Python
Back to main pageHave you ever seen one of those science experiments where you take a metal plate or flat surface, speaker/frequency generator, and some sand, and then, by playing certain frequencies, you can make the sand form patterns on the plate?
It's a phenomenon called Chladni patterns, named after Ernst Chladni, and they exhibit the nodes and anti-nodes of a particular material vibrating at a particular frequency. Now, I've been mesmerized by these through countless YouTube videos and the like, but I never have had the opportunity to make a rig myself and experiment in person. However, I've had this project on my mind for a while, and in lieu of buying the materials, I've written a little software trinket that lets me generate them, or at least what I think are pretty good approximations of them. This post's objective is to explaining some of the more interesting parts of how I'm thinking that Chladni patterns behave, and to document the code that I wrote to model it, which you can find here
Disclaimer: This is all my own theories about how the patterns are formed, so take everything I'm explaining below with a grain of salt.
First of all, I want to talk about the idea of a standing wave. When you have a string or other object with a wave traveling through it, if you can wobble the object at certain frequencies, you'll get a bunch of waves that seems to just go up and down, rather than moving side to side within the object. These non-moving (they don't walk, thus are called standing) waves have the property that at certain points along the line or string, called nodes, where there is no movement, the string just rotates around that point. Also, we aren't just limited to having standing waves in a string/one dimensional object. They exist in 2d surfaces, and this is what a Chladni pattern is illustrating, with the sand converging on the nodes of a plate or surface at a particular frequency.
The reason the sand converges to the nodes is simple; As the sand reaches the nodes of the material (having been bumped around by the more active parts of the plate in a semi-random fashion), they are at a point where they won't continue to bump around because there's no vibration at a node. It's the same reason leaves seem to accumulate in inside corners of buildings on windy days -- Leaves are protected from the wind in the inside corners, so it's much less likely that there's going to be a gust of wind that moves them out of the corner compared to the likelihood of a gust of wind pushing leaves into the corner.
Initially, my thinking for the model was to make a particle class, then have each particle bounce around in various directions depending upon their position on the plate until they came to a near-equilibrium. However, after programming a particle class (my logic was to start with the super easy stuff), I realized that I was still in the same boat that I had been previously. I still didn't have a method to determine how the particle bounced at any given point on the plate. It's all great to have particles that can move around, but unless you can figure out how they move, it's completely pointless.
I needed to identify how each point on the plate vibrated -- what makes a point a node versus an anti-node? It's not as simple as just tracing the waves out from the frequency emitter, because the waves reflect off of the edge of the material and return to interfere with the new waves coming out (this is part of the the definition of a standing wave, there needs to be a reflection and both constructive and destructive interference for a standing wave to work). Also, does that mean that for every point on a ray, you have to save the data? In thinking about it, it becomes evident that an emission approach would be ineffective. Instead of doing this, then, I applied some concepts that pertain to ray tracing on each and every point of the plate (pixels in the generated image). Much like in ray tracing, I treated each pixel as a sensor, sent some waves out from that sensor, then measured when they would intersect with the frequency emitter, positioned at the center of the plate.
However, to figure out in what direction the rays emitted by each pixel should be shot out in to most effectively encapsulate the strongest frequencies (single or double bounces, because after that point I figured that the amplitude of a wave was pretty marginal), I used an interesting trick that's easier to explain with a geometric interpretation of the system.
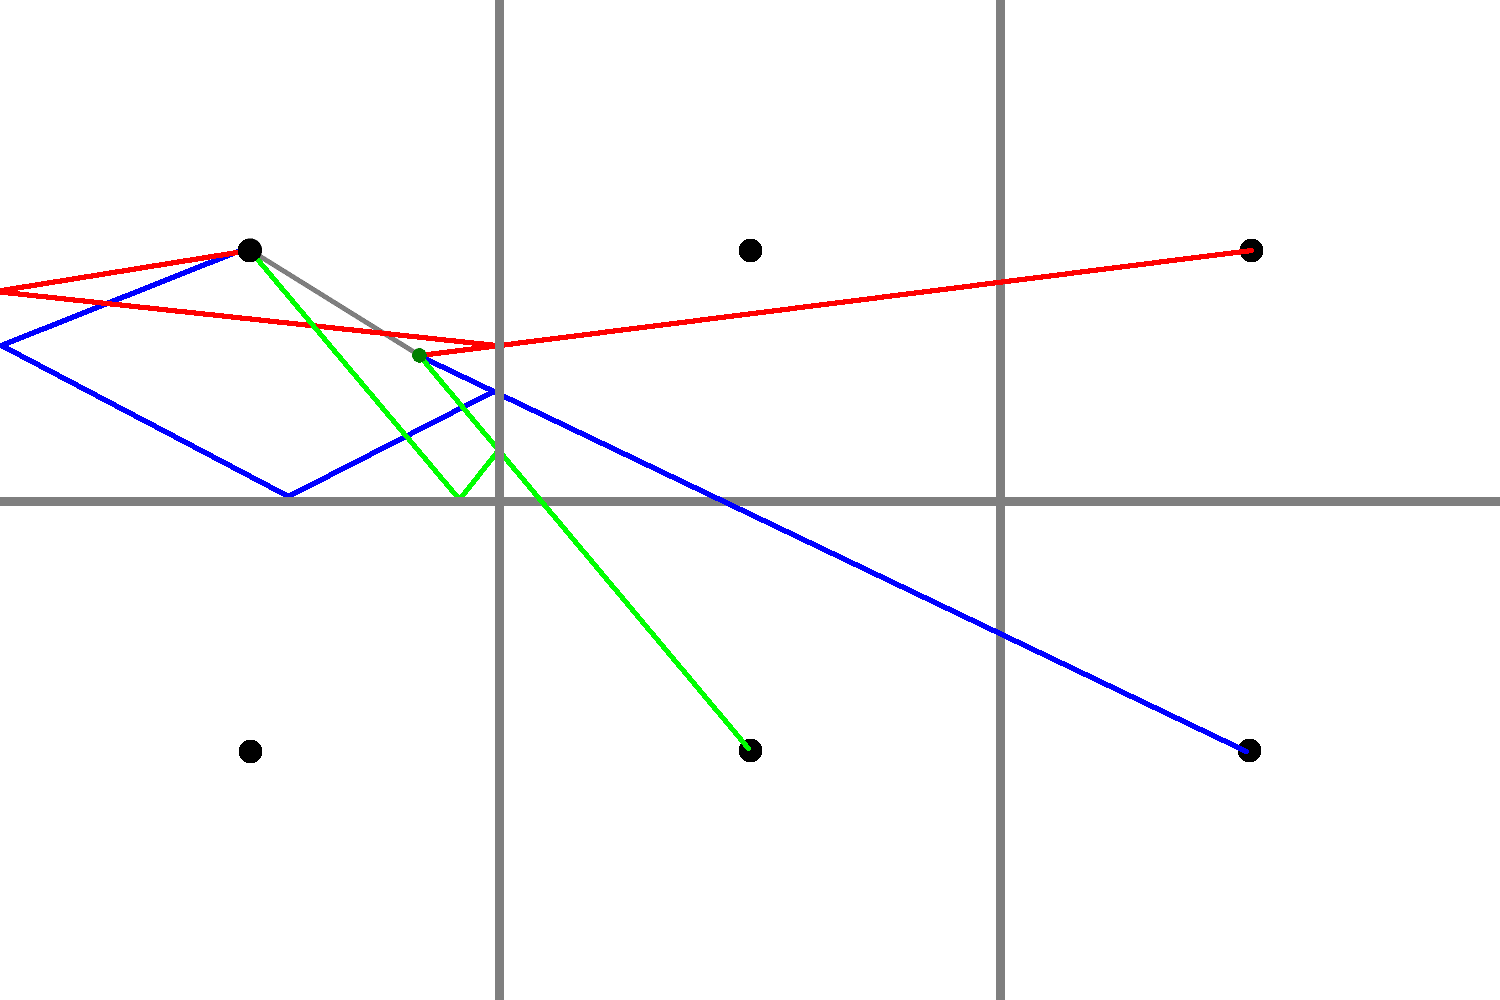
If you consider the plate to be a square, with the dark dot as the frequency emitter, and the colored dot as the point you want to inspect, you can draw the image like this:
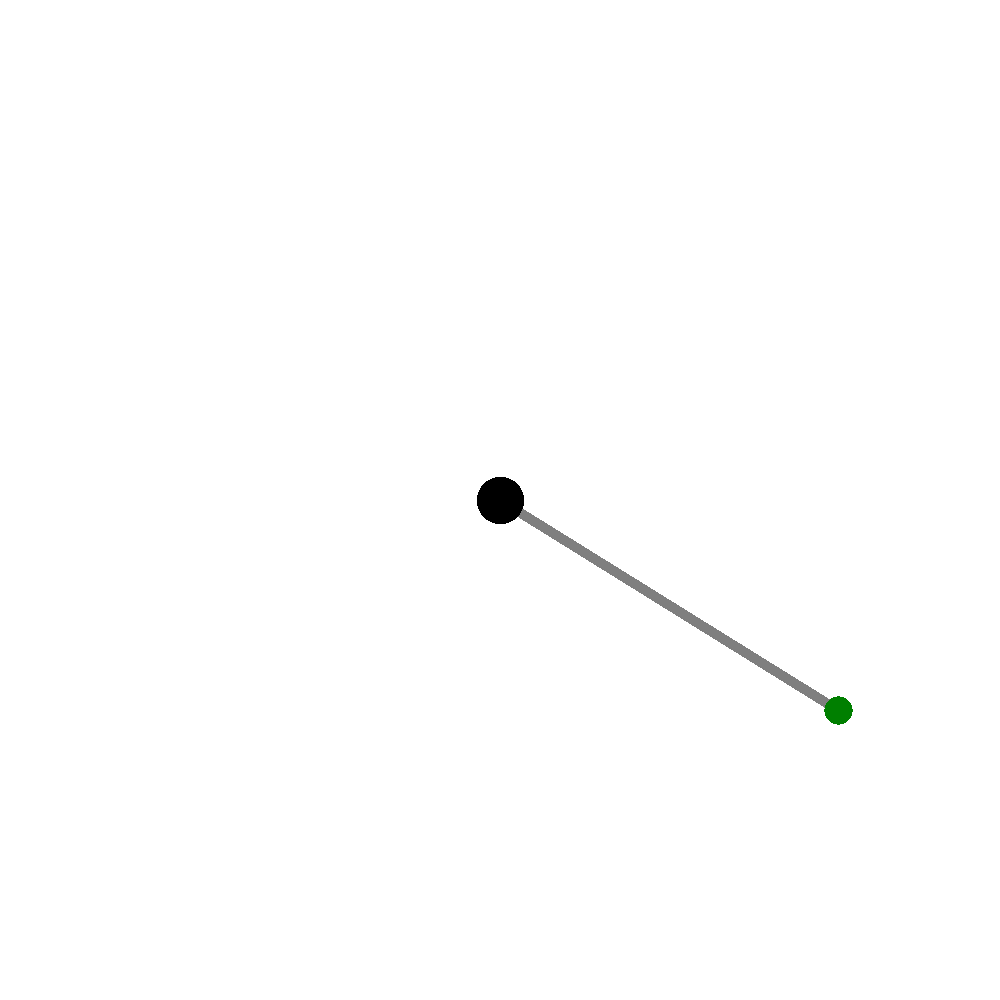
I've traced out the line that a wave in the plate takes directly from the frequency emitter to the inspected point. But, there's also going to be waves bouncing off of the edges of the plate that also contribute to the state of the inspecting point, so let's draw one of those in.
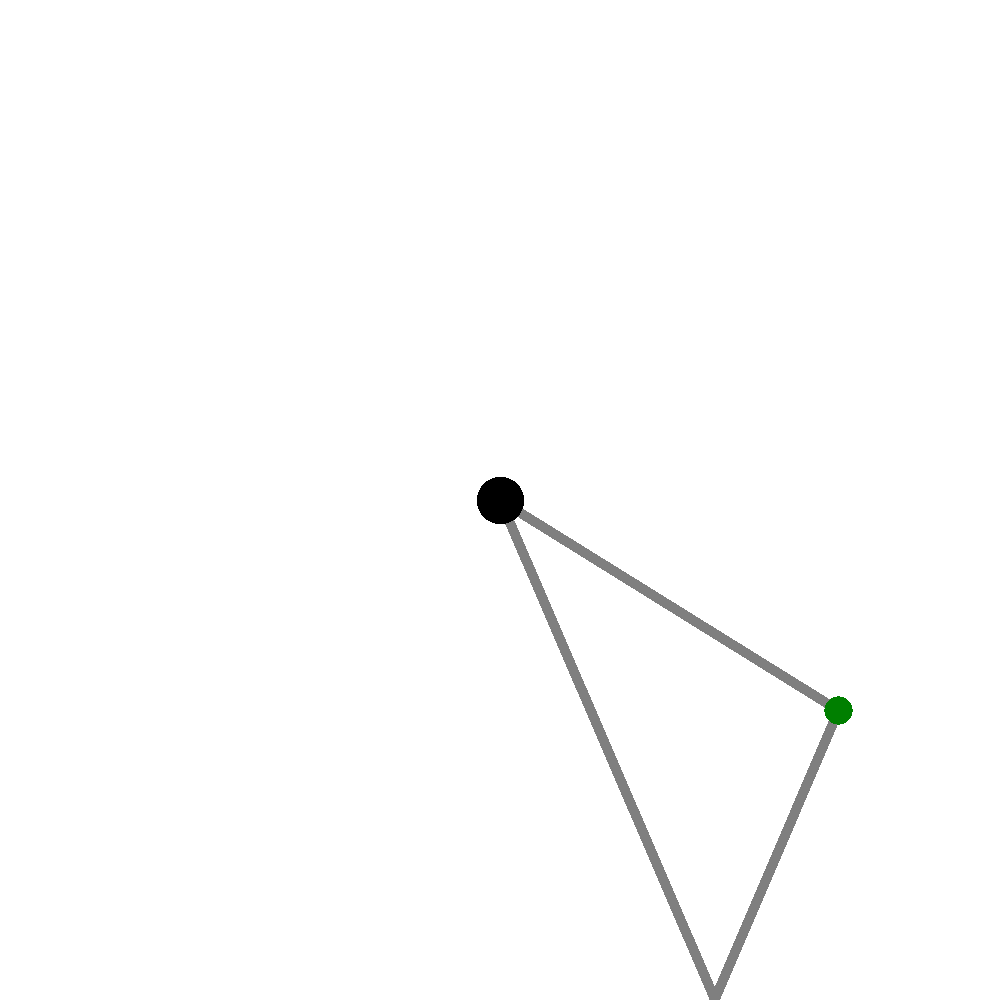
Reflections of the wave vibrations around the edge of the plate, just like light on a reflective surface, conserve angles, and because of this (think of mirrors and how images work with mirrors), you can pretend that there is another plate right next to the "real" plate, and draw a line connecting to this secondary plate. Thus, instead of doing reflection calculations, you can just pretend like there's another plate right next to the real one that you're modelling, and trace a straight line out from there, which represents the total distance that a wave would need to travel while bouncing around the edges and ultimately reaching the point at which you are measuring.
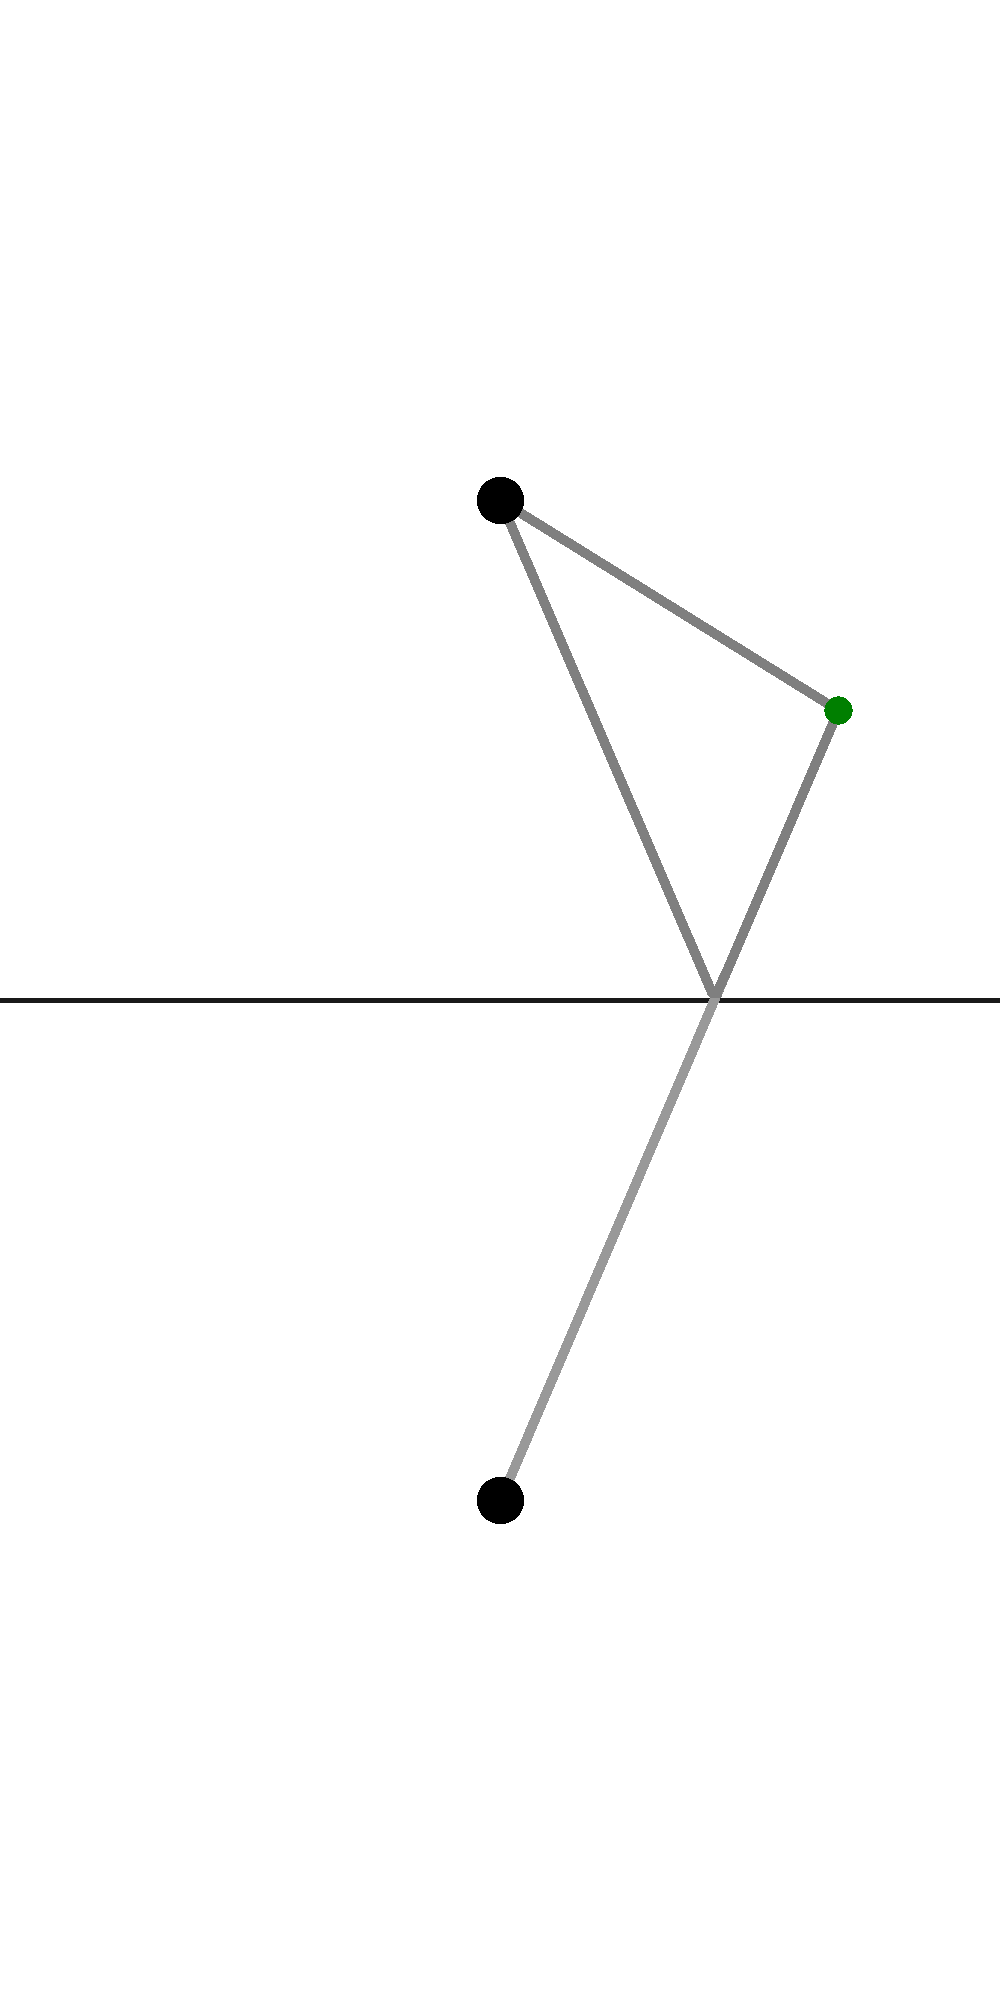
This works for as many reflections as you want to measure, just by tracing the lines out further and further across more and more "imaginary" plates.
I suppose it isn't that interesting of a revelation, but in the moment of writing the software, I felt very clever. It's an example of how thinking about a problem differently, with a different viewpoint or method, can lead to a solution that's quite beautiful, rather than a clunky and tiresome implementation.
The rest of the code is fairly straightforward, simply calculating the standard deviation of all of the various rays traced out from each point, and using that value to color the pixel representing that point on the plate.
As for some improvements, you'll notice that the plate is symmetrical across both the diagonals and the vertical and horizontal lines going through the corners and center, so this implementation is super inefficient. What I really should be doing is doing it for one of the eight triangles, then mirroring and rotating it to get the other parts of the plate. However, I didn't realize it in the moment, and I might come back to it eventually, but I've moved onto other projects now.
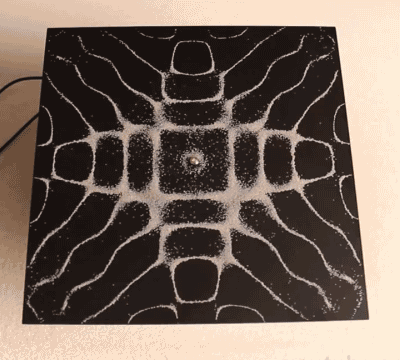
To end the post, here's a gif of the modelled plate incrementing from a unitless frequency of 10 to 20:
And again, if you want to look at the code that this whole post has been talking about, here it is